CCL / FQ3 2026 - Aug 2026
Carnival Corporation Ltd.
Reports Sep 29 · Time not specified
Publication status
Awaiting results
Sep 28, 2026, 9:00 AM PDT
Shortcut EPS
1.33
USD per share
Street EPS
1.35
USD per share
Actual EPS
—
Pending
Financial workbook
Explore the model.
Explore the assumptions and calculations behind this earnings forecast.
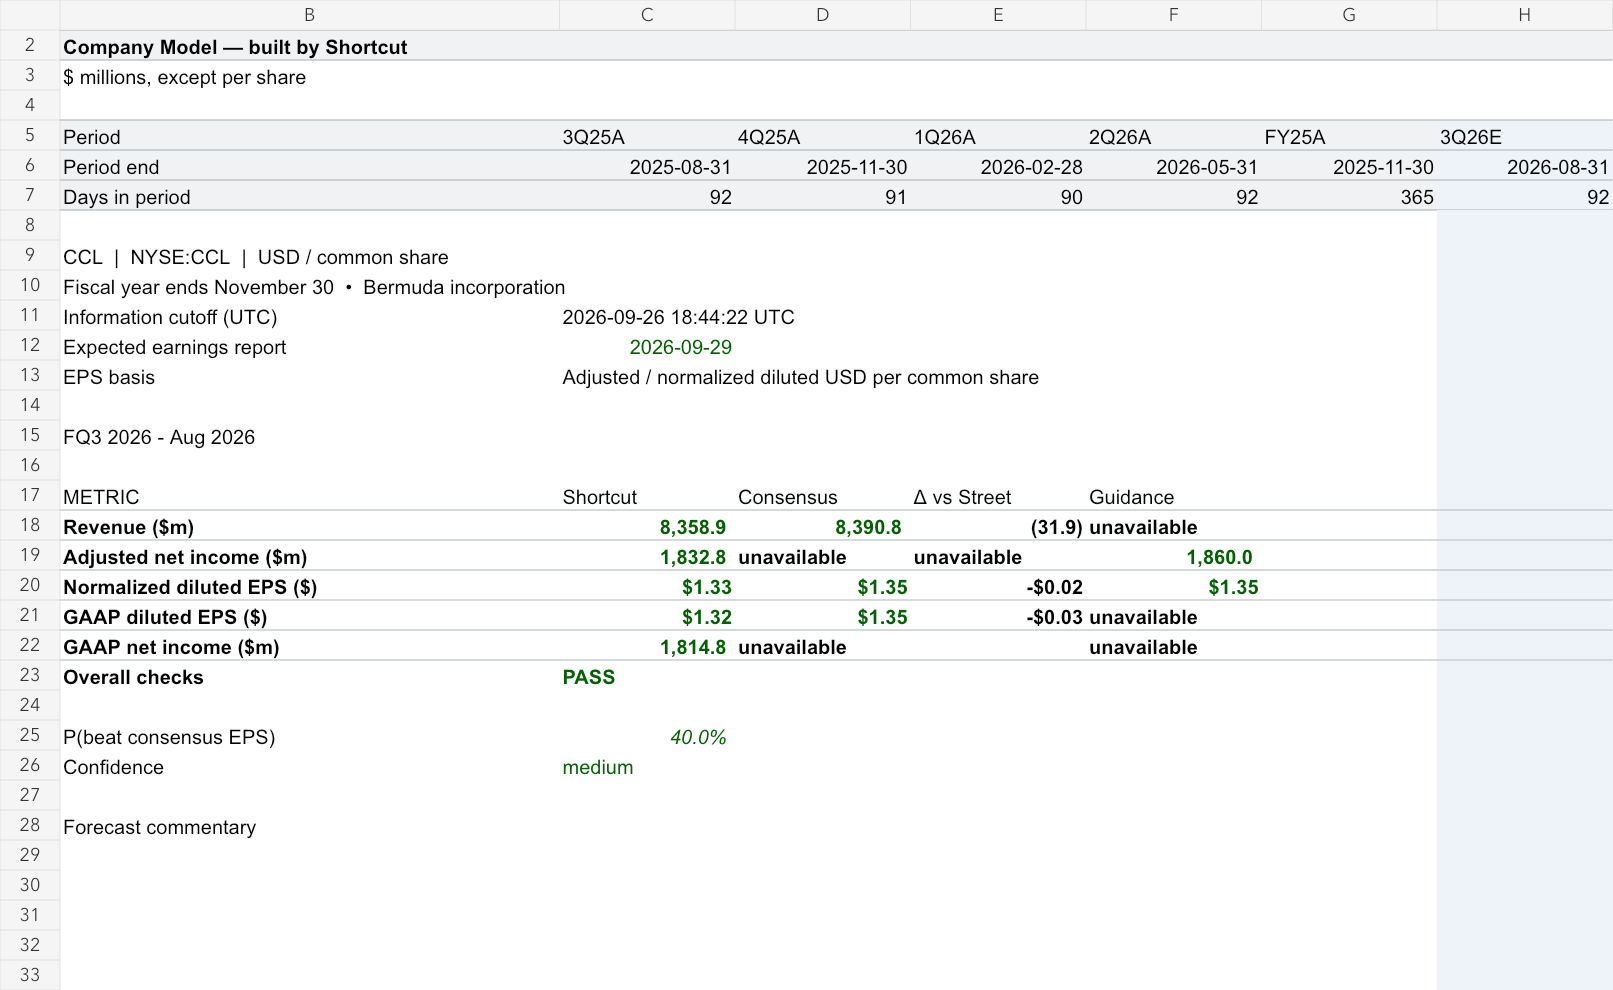
CCL · Workbook preview
What drives the forecast
- June 23 guidance targets adjusted Q3 net income of approximately $1.86bn and diluted EPS of $1.35 on 1,377m shares; historical Q4/Q1/Q2 guidance was beaten, but guidance already reflected Middle East disruption.
- September 24 CapIQ normalized consensus is $1.35 on 21 normalized contributors and revenue is $8,390.79m; September 24 Zacks described an 11.8% downward EPS revision in the prior month.
- Jefferies' September 23 preview cited unhedged fuel and weaker advertised cruise fares, lowered Q3 revenue to $8.36bn, while still forecasting adjusted EBITDA $2.93bn versus guidance $2.88bn; assume only a small miss rather than extrapolating crude prices directly to booked fuel.
- Model projects 1.5% Q3 ALBD growth, segment revenue of $8,358.891m (North America $5,492.396m; Europe $2,589.265m; Cruise Support $103.6m; Tour $173.63m), $620m fuel and $740m depreciation, reflecting European booking and fuel headwinds.
- Royal Caribbean's July 28 results showed strong close-in demand but modest Mediterranean booking pressure; company had 93% of FY26 booked in June, limiting both upside and downside. Forecast adjusted EPS of $1.331 is below consensus with 40% probability of strictly beating it.
The Street baseline: CapIQ export, September 24, 2026. Results are scored only after the earnings basis is matched. Read the methodology.