Travelers
Oct 12, 2026, 2:38 AM PDT
Shortcut
7.51Shortcut normalized EPS
+2.1% vs Street*
Street
7.36Street normalized EPS
Frozen October 11 snapshot
Real
9.18Core income per diluted share
Shortcut win
Shortcut off by $1.67 · Street off by $1.82.
Uses core income per diluted share of $9.18, excluding net realized investment losses ($9.04 GAAP), consistent with the model’s core-income basis. The score compares published values; exact normalization matching remains unverified.
Issuer earnings release ↗Explore the model.
Open the assumptions and calculations behind this earnings forecast.
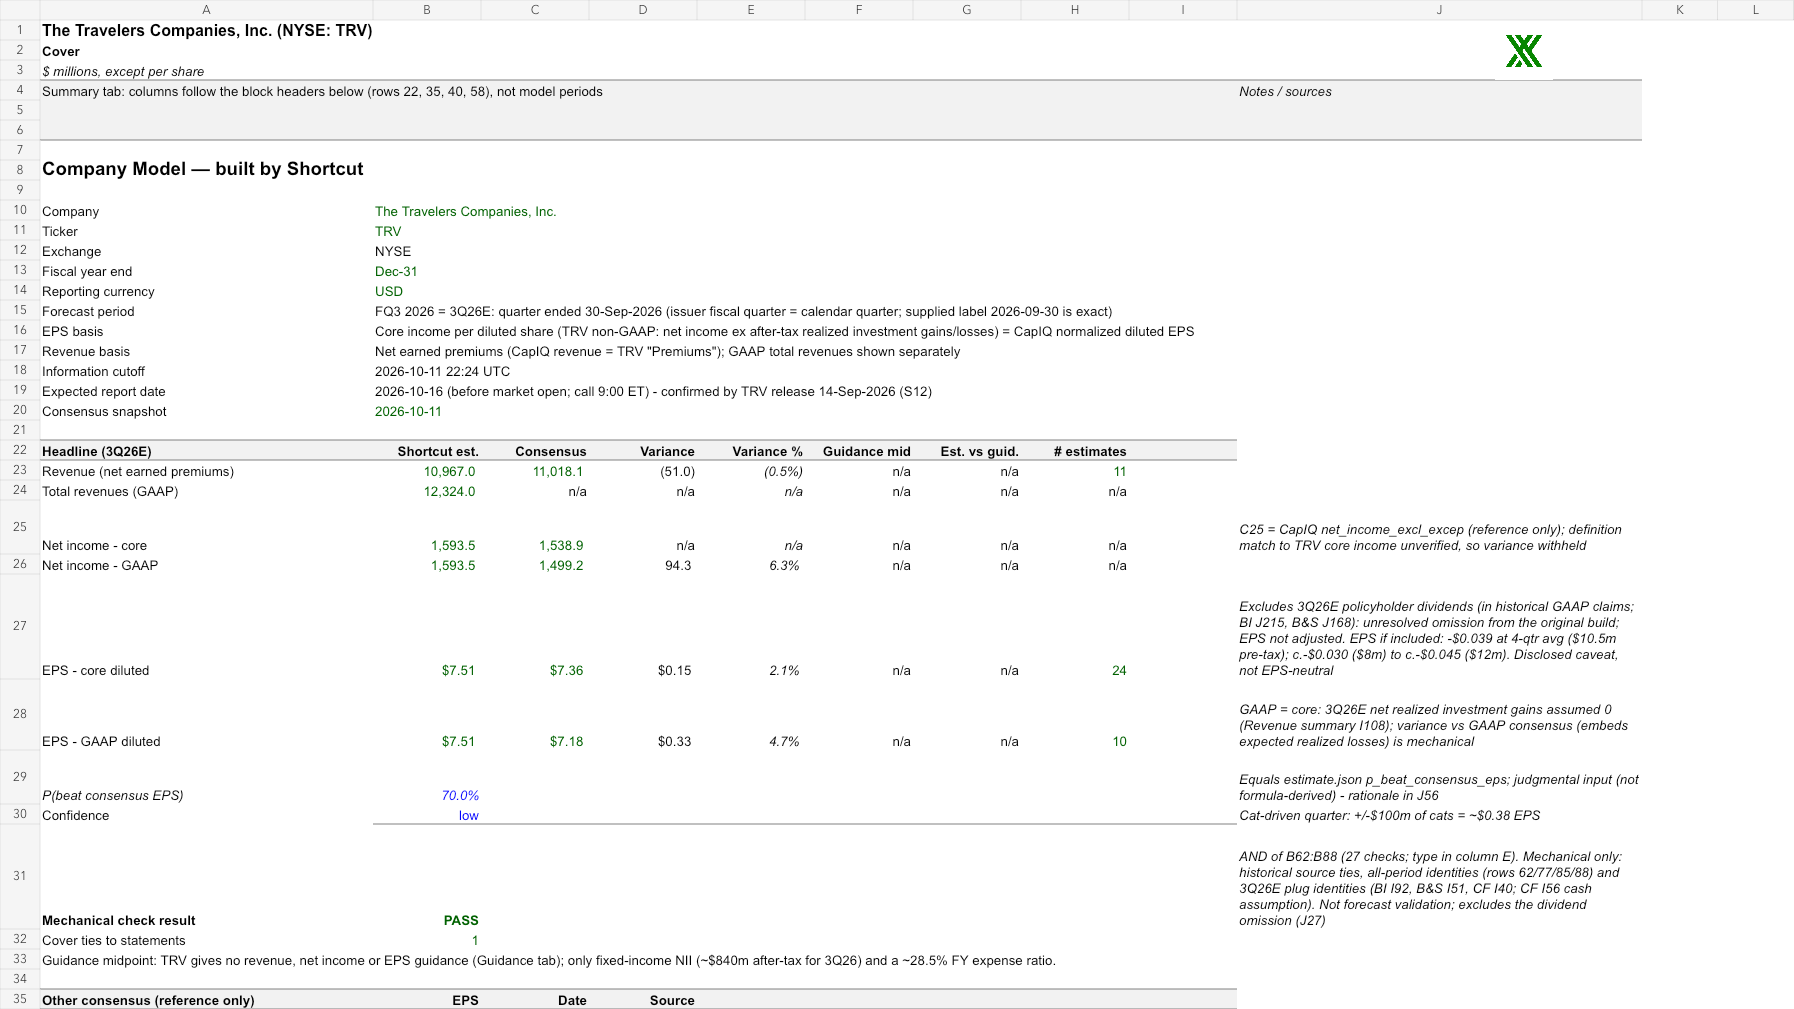
Behind the estimate.
The model forecasts $7.51 per diluted share for the quarter ended September 30, 2026.
Forecast and independent review: Opus 5.5 High in Shortcut.
Model assumptions and review notes
- Modeled normalized EPS; comparability with the frozen Street definition remains unconfirmed. The score compares published values directly.
- F01 policyholder dividends excluded from BI I174 / B&S I127; no evidence-determined 3Q26E level. EPS sensitivity -0.0298 / -0.0391 / -0.0447 at $8m / $10.5m / $12m pre-tax. EPS-relevant caveat.
- F02 forward normalized consensus contributor basis vs TRV core unconfirmed (historical 6/6 equal; NI excl. exceptional implies ~$7.26 vs $7.36).
- F03 historical consensus snapshot timing unverified; P(beat) 0.70 judgment with no recorded blend weight; Playbook v2 priors unregistered.
- F05 FI NII calibration retained: +$0.037 EPS if $840m after-tax guide realized literally.
- F06 Canada mixed-scope earned-ratio / per-policy drivers: ~+$0.01 (BI) indicative, PI unquantifiable.
- F11 buyback price $345 judgment: -$0.003 EPS at $368.75 close (now disclosed).
- Cover!J30 '~$0.38 per $100m cats' is an approximation; at the 21% rate the computed figure is ~$0.3725 (pre-existing rationale text, no EPS dependency; left unchanged, not a confirmed error).
- Source capture timestamps: financial inputs and consensus frozen per the October 11 manifest at date precision; no capture timestamps invented; no post-cutoff sources used.
- Rendering: fit verified by font-metric estimate only; round-1 record of the screenshot-protocol deviation preserved; no vision/other model used.
- Policyholder dividends omitted from 3Q26E BI/B&S claims (F1). This is an actual EPS defect: about -$0.039, range -$0.030 to -$0.045. The level is not determined by workbook evidence, so it remains for the next repair round or must be published as a caveat.
- Forward 3Q26 normalized consensus basis vs TRV core income is unconfirmed (F2). Basis equality is shown for actuals only. EPS sensitivity cannot be quantified.
- Judgmental tax rate on non-NII pre-tax of 21% (Income Statement I93) vs 2026 YTD implied rates of 18.7% and 22.0%. Non-NII pre-tax is about 877 (segment ex-NII 1003.4 less 126 corporate), so each 1pt is about $8.8m, or about ±$0.041 EPS. Retained as judgment.
- FI NII after-tax is about $832m vs the $840m guide (F3): +$0.037 EPS if the guide is met. Retained judgment.
- Earned-ratio Canada scope drag (F4): about +$0.01 per the workbook estimate. 2024 Canada NWP is not sourced.
- Calibration evidence: market cap is blank (third-party S24 used); cohort priors and Playbook v2 are unregistered; historical consensus snapshot timing is unverified; final P(beat) of 0.70 has no recorded blend weight (F11). No EPS dependency.
- Supporting lines with no EPS dependency: CFO zero assumptions; capex absorbed in the FM plug; share comp missing from the common-stock rollforward; AOCI held flat; FY25A KPI simple averages; FY25A EPS on approximate shares (F7-F10).
- No sheet contains frozen panes, so there is nothing to remove.
- Protocol disclosure: round-1 repair used three default Gemini Flash screenshot inspections for layout; its report states no forecasting or financial extraction relied on them. Subsequent repairs and the final independent audit used Opus 5.5 High. The round-1 dividend averaging assumption was reversed in round 2; the original EPS is preserved with the omitted-dividend sensitivity disclosed.
On the record.
- Reporting period
- Q3 2026 (quarter ended September 30, 2026), ended 2026-09-30
- Reporting basis
- Core income per diluted common share (TRV non-GAAP = normalized diluted EPS), USD; Income Statement!I133 = I124 / I126 (Share Count!I38); core income I100 = GAAP NI I47 - realized gains after tax (I98 = 0) - other exclusions (I99 = 0); participating allocation I121 = -I100 x I114 (0.7172%). Bank-style attribution: net income to common = core income less participating-award allocation (I124 = 1,582.056).
- Published
- Oct 12, 2026, 2:38 AM PDT
- Model / effort
- Opus 5.5 · High effort
Original forecasts, models and publication times remain on the record.
Research sources
- https://www.sec.gov/Archives/edgar/data/86312/000008631226000143/a992finsupp63026.htm
- https://www.sec.gov/Archives/edgar/data/86312/000008631226000143/a991pressrelease63026.htm
- https://s26.q4cdn.com/410417801/files/doc_financials/2026/q2/2Q26-Transcript.pdf
- https://www.sec.gov/Archives/edgar/data/86312/000008631226000110/a992finsupp33126.htm
- https://www.sec.gov/Archives/edgar/data/86312/000008631225000068/a992finsupp93025.htm
- https://www.sec.gov/Archives/edgar/data/86312/000008631225000046/a992finsupp63025.htm
- https://www.sec.gov/Archives/edgar/data/86312/000008631225000028/a992finsupp33125.htm
- https://investor.travelers.com/newsroom/press-releases/news-details/2026/Travelers-Reports-Excellent-First-Quarter-Results/default.aspx
- https://s26.q4cdn.com/410417801/files/doc_financials/2026/q1/1Q26-TRV-Transcript-1.pdf
- https://www.fool.com/earnings/call-transcripts/2025/10/16/travelers-trv-q3-2025-earnings-call-transcript/
- https://intellectia.ai/stock/TRV/earnings/earning-forecast-2026-01-21
- https://investor.travelers.com/newsroom/press-releases/news-details/2026/Travelers-Schedules-Conference-Call-to-Review-Third-Quarter-2026-Results/default.aspx
- https://www.prnewswire.com/news-releases/july-2026-monthly-release-302856389.html
- https://www.prnewswire.com/news-releases/august-2026-monthly-release-302882017.html
- https://www.allstatenewsroom.com/news/september-2025-monthly-release/
- https://www.sec.gov/Archives/edgar/data/899051/000089905126000111/exhibit99newsrelease071626.htm
- https://www.reinsurancene.ws/gallagher-re-reports-multi-billion-dollar-loss-from-early-august-us-severe-weather-outbreak/
- https://www.insurancecapitaldaily.com/story/washington-s-insurance-regulator-puts-spokane-wildfire-losses-at-772-million
- https://www.insurancecapitaldaily.com/story/aon-estimates-nor-easter-and-hurricane-polo-each-left-hundreds-of-millions-in-lo
- https://www.nhc.noaa.gov/archive/2026/al09/al092026.update.10100129.shtml
- https://investor.progressive.com/financials/financial-news-releases/news-details/2026/Progressive-Reports-August-2026-Results/default.aspx
- https://stockanalysis.com/stocks/trv/market-cap/
- https://finance.yahoo.com/markets/stocks/articles/travelers-trv-expected-beat-earnings-130005897.html
- https://www.marketbeat.com/instant-alerts/upcoming-travelers-companies-trv-expected-to-release-earnings-on-friday-2026-10-09/
- https://www.benzinga.com/analyst-stock-ratings/price-target/26/10/62240307/top-wall-street-forecasters-revamp-travelers-expectations-ahead-of-q3-earnings
- https://riskandinsurance.com/record-low-catastrophe-losses-bolster-insurance-industrys-financial-health/
- https://www.sec.gov/Archives/edgar/data/86312/000008631224000058/a991pressrelease93024.htm
- https://www.insurancejournal.com/news/national/2023/10/18/744741.htm
- https://insight.factset.com/sp-500-earnings-season-update-july-31-2026
- https://investor.travelers.com/newsroom/press-releases/news-details/2026/Travelers-Completes-Sale-of-Canadian-Personal-Insurance-Business-and-Majority-of-Its-Canadian-Commercial-Insurance-Business-to-Definity/default.aspx
- https://seekingalpha.com/news/4575841-travelers-expects-after-tax-fixed-income-net-investment-income-to-reach-about-870m-in-q4-2026
- https://secure.earningswhispers.com/article/TRV/20355
- https://s26.q4cdn.com/410417801/files/doc_financials/2026/q2/2Q26-Webcast-FINAL.pdf